K-Means clustering: Implmentation and Analysis#
After reading about the section K-Means Clustering in the book, I decided to implement naive (vanilla) K-Means clustering by myself.
Here’s what I did. (some details omitted for brevity, you can find my full implementation as a Jupyter Notebook on Kaggle)
 1def kmeans(
 2    X,
 3    centers: int,
 4    *,
 5    tolerance: float,
 6    max_iter: int,
 7    random_state: int | None = None,
 8):
 9    rng = np.random.default_rng(random_state)
10    centroids = rng.choice(X, size=centers, replace=False)
11
12    for n in range(max_iter):
13        # Determine the closest centroid for each data point
14        closest_centroid = np.array(
15            [np.argmin([np.linalg.norm(x - c) for c in centroids]) for x in X]
16        )
17
18        # Update the centroids
19        new_centroids = [
20            np.mean(X[closest_centroid == i], axis=0) for i in range(centers)
21        ]
22
23        # Loop until we are done
24        if np.allclose(centroids, new_centroids, atol=tolerance):
25            break
26
27        centroids = new_centroids
28
29    return closest_centroid, centroids
However, today’s focus is not on how I implemented the algorithm, as my code above is mostly (hopefully) self-explanatory, but on the analysis of the execution results. In case you are unfamiliar with the algorithm, you can find a Wikipedia article on K-Means here.
Analysis#
In total, I ran the K-Means algorithm on generated data with 2, 3, 4 and 5 clusters, and a cluster_std
of 0.2, 1.0, 1.8 and 2.6 (determines how diffuse the generated points are). For each of the combinations,
I configured a random_state of 0 through 19, so as to avoid the effect of randomness on the results.
General Performance#
The following table shows the performance of the algorithm on each of the configurations
# of clusters |
2 |
3 |
4 |
5 |
|---|---|---|---|---|
0.2 |
A |
B(0.35) |
B(0.4) |
C |
1.0 |
A- |
B(0.2) |
B(0.25) |
B(0.45) |
1.8 |
A- |
B-(0.15) |
B-(0.15) |
B- |
2.6 |
A- |
B- |
B- |
B- |
Note
grades
A: excellent
B: good (error rate less than 0.5)
C: poor
annotations
“-”: has overlap problem
“(error_rate)”: estimated error rate shown in parentheses
We can infer from the plot that:
As the number of clusters increases, the performance of K-Means generally goes down
Possible explanation: K-Means rely on random selection of initial centroids. The more clusters, the less likely the centroids are evenly distributed among the actual clusters.
As
cluster_stdincreases, the error rate goes downPossible explanation: It becomes easier for the centroid to jump between clusters as
cluster_stdincreases. (See section Steps)As
cluster_stdincreases, the problem of overlap becomes more significantPossible explanation: High
cluster_stdmakes it easy for clusters to overlap with each other.
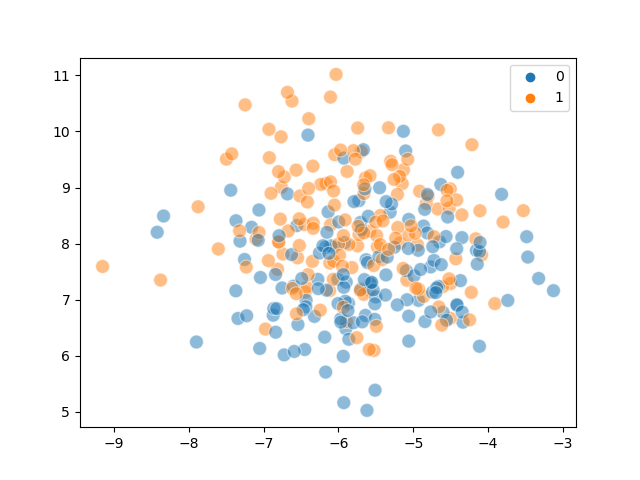
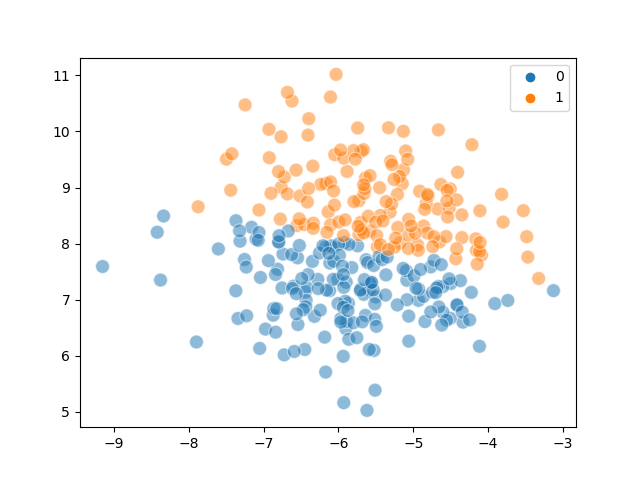
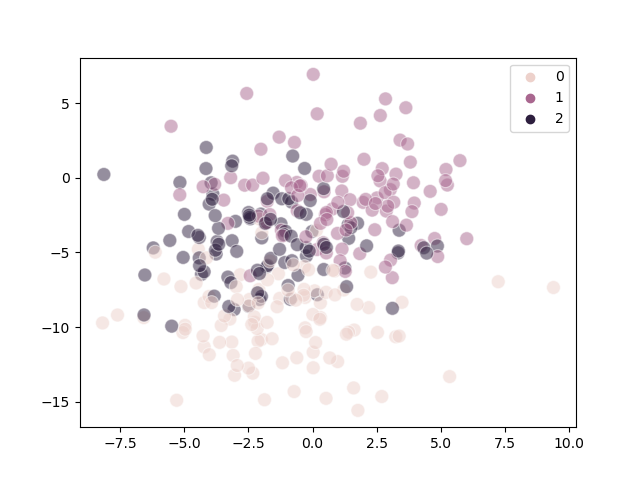
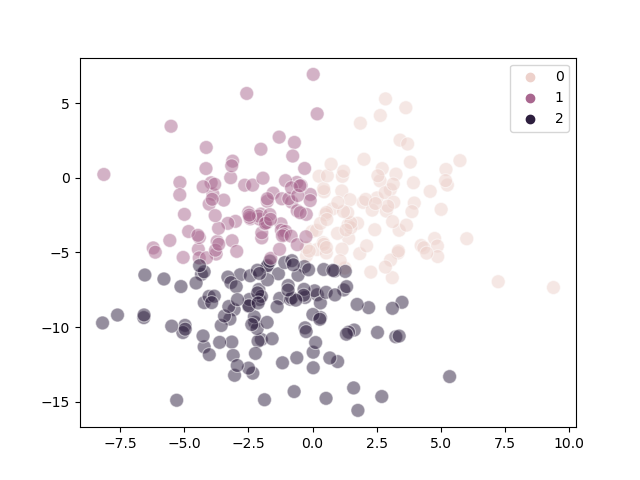
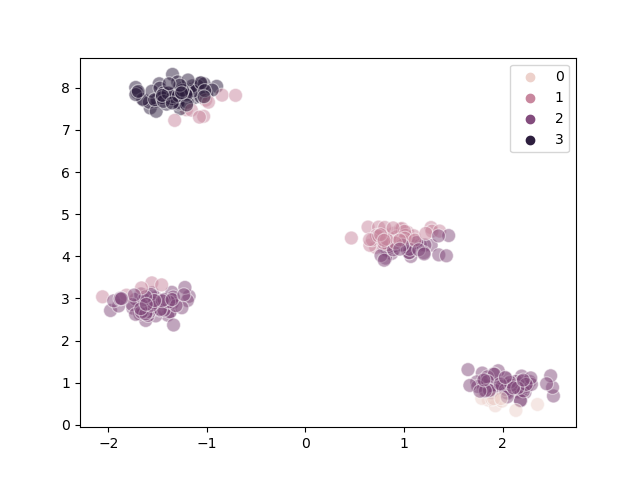
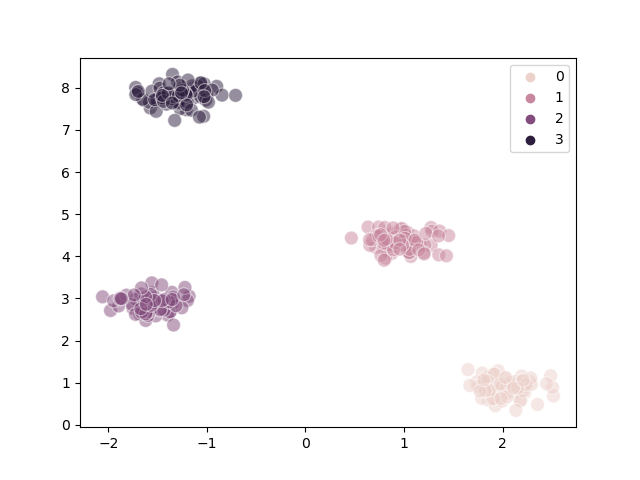
Overlap#
When clusters become too close to each other, they overlap. This makes it extremely hard for clustering algorithms to separate the clusters. (The same problem exists for supervised classification)
The following diagrams demonstrate the overlap problem:
Actual |
Predicted |
|---|---|
|
|
|
|
Steps#
We can visualize the individual steps the K-Means algorithms made during the clustering process.
The following is a well-clustered example:
Steps |
Diagram |
|---|---|
1 |
|
2 |
|
3 |
|

The following is a poorly-clustered example:
Steps |
Diagram |
|---|---|
1 |
|
2 |
|
3 |
|


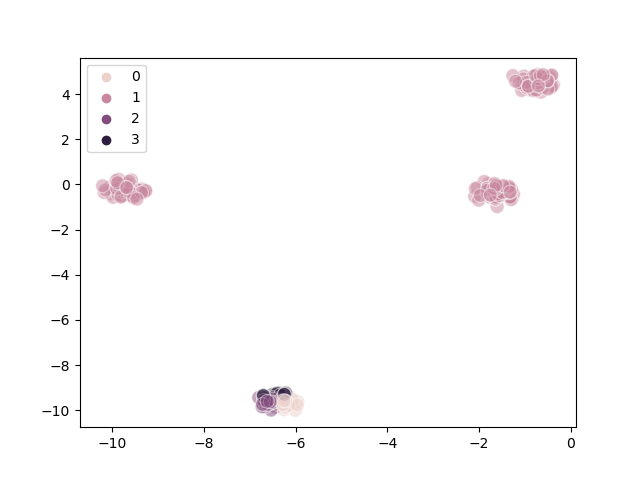
We can infer from the diagrams that:
Poor clustering probably results from poor initial choice of centroids
The algorithm converges quite quickly
Empty cluster#
It is possible that empty clusters will appear during the algorithm (as stated in the book), and I indeed got a warning for that:
/opt/conda/lib/python3.10/site-packages/numpy/core/fromnumeric.py:3432: RuntimeWarning: Mean of empty slice.
  return _methods._mean(a, axis=axis, dtype=dtype,
/opt/conda/lib/python3.10/site-packages/numpy/core/_methods.py:182: RuntimeWarning: invalid value encountered in divide
  ret = um.true_divide(
Afternote#
There are three main() functions in the notebook.
You can select from them to generate the diagrams in this blog post. What each of them does is implementation
detail and will not be explained in this post.
Conclusion#
The K-Means algorithm is an incredibly efficient algorithm and can perform clustering tasks with great accuracy as long as the initial centroids and number of clusters are well-chosen.